S&P 500 (^GSPC) - Financial Analysis - I
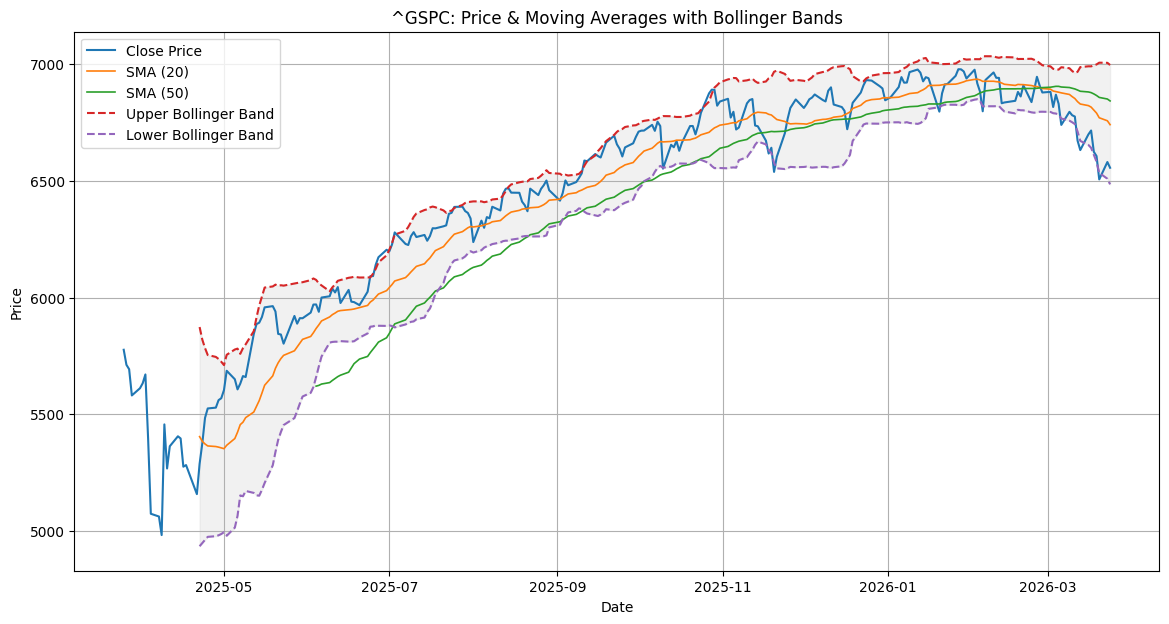
S&P 500 index (^GSPC) along with moving averages and Bollinger Bands, which are commonly used to understand trend and volatility.
Financial Information about S&P 500 (Standard and Poor’s 500).
Price & Moving Averages with Bollinger Bands
This is your trend and volatility chart.
-
SMA (20 & 50): These smooth out price action. When the shorter SMA (20) is above the longer SMA (50), it generally indicates a bullish trend. Notice how the price often uses these lines as “support” during an uptrend.
-
Bollinger Bands: These measure volatility.
-
The “Squeeze”: When the red and purple dashed lines get close together, volatility is low, often preceding a big move.
-
Overextension: When the blue price line touches or breaks the Upper Band, the asset is considered “stretched” or overbought in the short term. Conversely, touching the Lower Band suggests it might be oversold.
-