S&P 500 (^GSPC) - Financial Analysis - II
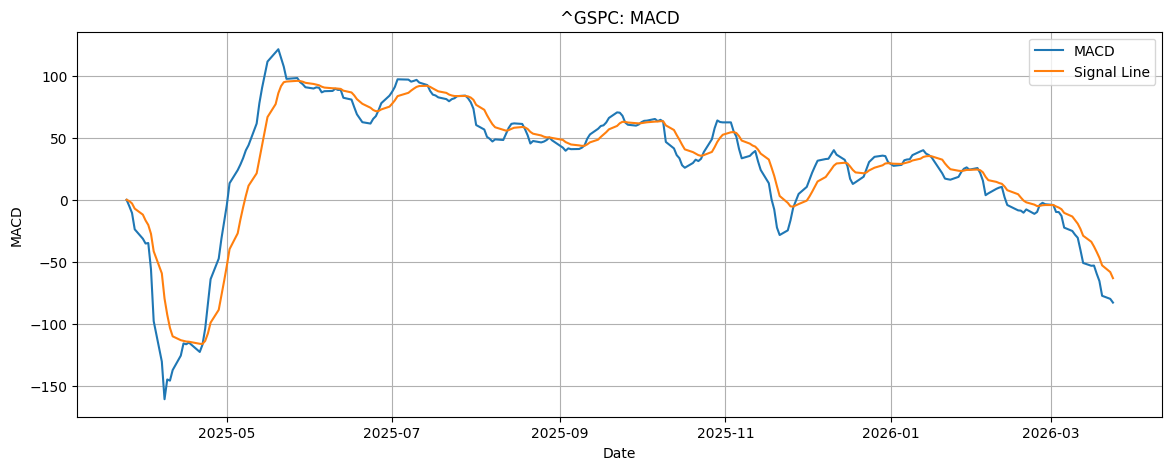
MACD (Moving Average Convergence Divergence) for the S&P 500 index (^GSPC), which helps you understand momentum and trend changes.
Financial Information about S&P 500 (Standard and Poor’s 500).
MACD (Moving Average Convergence Divergence)
This tells you about trend strength and direction changes.
-
Crossovers: When the blue MACD line crosses above the orange Signal Line, it’s a bullish signal. When it crosses below, it’s bearish.
-
Zero Line: When the MACD is above zero, the short-term momentum is stronger than the long-term momentum (bullish).
-
The Gap: The distance between the two lines shows the strength of the trend. A widening gap means the trend is accelerating.