S&P 500 (^GSPC) - Financial Analysis - III
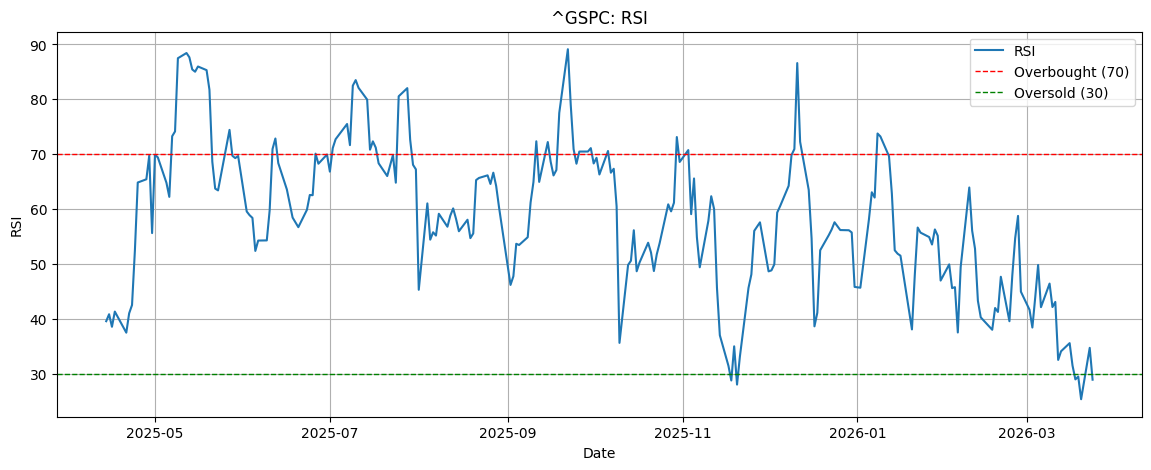
RSI (Relative Strength Index) for the S&P 500 index (^GSPC), that measures the speed and change of price movements.
Financial Information about S&P 500 (Standard and Poor’s 500).
RSI (Relative Strength Index)
This is a momentum oscillator that measures the speed and change of price movements.
-
Overbought (> 70): When the blue line crosses the red dashed line, the stock has potentially risen too far, too fast, and a pullback or consolidation is likely.
-
Oversold (< 30): When it drops below the green line, the “selling pressure” may be exhausted, signaling a potential buying opportunity.
-
Divergence: Analysts look for cases where the price makes a “higher high” but the RSI makes a “lower high”—this is often a warning that the trend is losing steam.