S&P 500 (^GSPC) - Financial Analysis - IV
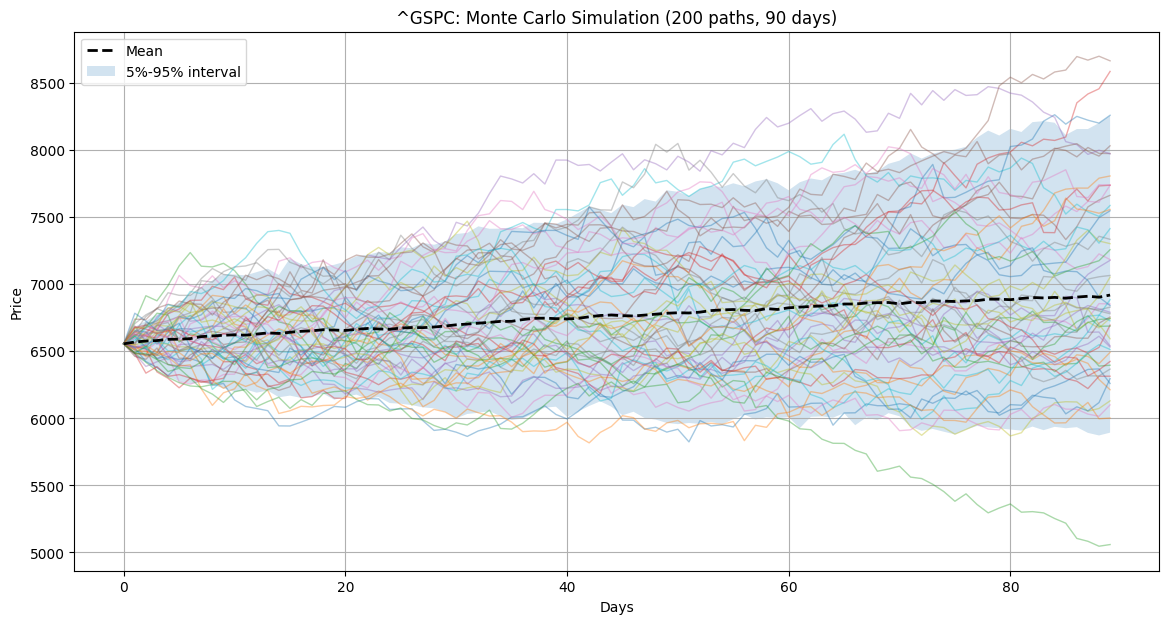
Monte Carlo Simulation for the S&P 500 index (^GSPC).
Financial Information about S&P 500 (Standard and Poor’s 500).
Monte Carlo Simulation
Unlike the others, this isn’t “technical analysis” in the traditional sense; it’s probabilistic forecasting.
-
The Paths: Each colored line is a “random walk” based on the stock’s historical average return and volatility (standard deviation).
-
The 5%-95% Interval: This shaded area is crucial. It tells you that, based on past behavior, there is a 90% statistical probability that the price will stay within that blue zone after 90 days.
-
The Mean (Dashed Black Line): This represents the “expected” outcome if the stock continues its current drift. It helps you see if the current price is significantly deviating from its historical growth trajectory.
Summary Table
| Indicator | Primary Use | Signal to Watch |
|---|---|---|
| SMA | Trend Direction | Crossovers (Golden/Death Cross) |
| Bollinger Bands | Volatility/Range | Price “walking” the bands or “squeezing” |
| RSI | Momentum | Extremes (70+ or 30-) |
| MACD | Trend Strength | Signal line crossovers |
| Monte Carlo | Risk Management | The width of the 5%-95% confidence interval |