S&P 500 (^GSPC) - Financial Analysis - VI
Based on the Candlestick & Volume Analysis (Last 90 Days) for S&P 500 (^GSPC), here is a synthetic technical summary:
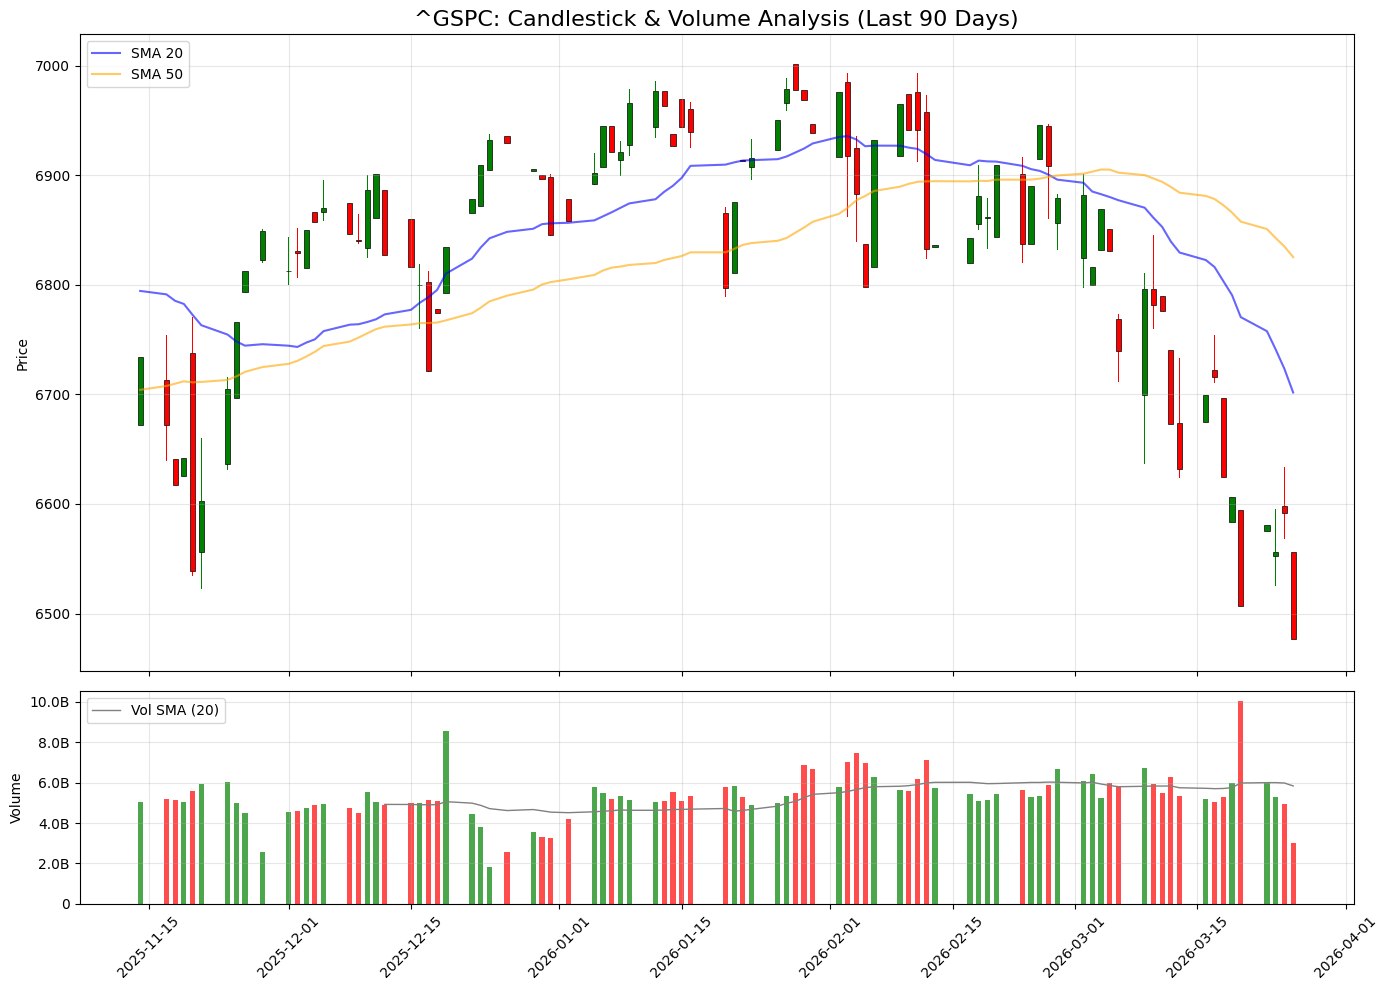
Bearish Momentum & Trend Shift
-
Trend Reversal: The price has decisively broken below both the SMA 20 (Blue) and SMA 50 (Yellow). The SMA 20 has crossed below the SMA 50, confirming a “Death Cross” or bearish trend shift in the short-to-medium term.
-
Price Action: Recent candlesticks show aggressive selling with long red bodies and minimal lower wicks, indicating that bears are in full control and closing near session lows.
-
Volume Confirmation: The sharp price drop in late March is accompanied by a significant spike in volume (surpassing the 20-day Vol-SMA). This validates the downward move, showing high institutional conviction behind the sell-off.
-
Support/Resistance: The previous support level near 6,900 has now flipped into resistance. The index is currently in a “price discovery” phase to the downside, looking for a new floor.