A Python Framework for Technical Analysis: 10 Indicators, Adaptive Methodology, and a Transparent Verdict System
An introduction to the automated technical analysis reports I will be sharing regularly — what each indicator measures, why each one is included, and how the adaptive weighted scoring system produces an auditable Overall Verdict.
Over the coming weeks I will be sharing regular technical analysis reports generated by a Python framework I have been building and refining. This post is the foundation for all of those future posts: it explains what the framework does, what each indicator measures, why each one earns its place in the analysis, and — most importantly — how the overall verdict is calculated and why you can verify every number yourself.
Every chart and report I share will be produced by the same code, applied to different tickers and time horizons. This post gives you the tools to read them.
What the framework produces
For any ticker available on Yahoo Finance and any analysis window, the framework generates:
- 11 charts covering every major dimension of technical analysis
- 7 narrative conclusion pages — one per analytical section plus an overall verdict
- A 19-page PDF report collecting everything in a single shareable document
- 18 PNG images at 150 dpi, optimised for social sharing
The two inputs are:
| Input | Options | Effect |
|---|---|---|
| Ticker | Any Yahoo Finance symbol: ^GSPC, AAPL, BTC-USD, TSLA, … |
Determines the asset being analysed |
| N_DAYS | 90, 180, 365, 730 |
Sets the analysis window and triggers automatic adaptation of all indicators and weights |
The ten indicators
1 · Simple Moving Averages (SMA)
What it is. The arithmetic mean of the last N closing prices. Four periods are computed: SMA 20 (~1 month), SMA 50 (~2.5 months), SMA 100 (~5 months), SMA 200 (~10 months).
What it tells you. Price above an SMA means buyers are stronger than that average — bullish. Price below means sellers dominate — bearish. The SMA 200 is the most watched line by institutional investors globally: price above it defines a broad bull market structure; below it, a bear market structure.
Key events the code detects automatically:
- Death Cross — SMA 20 crosses below SMA 50. One of the most watched bearish signals by institutional investors. The code annotates the exact date, shades the bear phase in red, and checks whether the gap has been widening (signal strengthening) or stable.
- Golden Cross — SMA 20 crosses above SMA 50. The bullish counterpart.
2 · Bollinger Bands (BB)
What it is. An envelope of ±2 standard deviations around a moving average. Approximately 95% of price action falls inside the bands statistically.
Upper Band = SMA + 2 × STD   →  dynamic resistance
Lower Band = SMA − 2 × STD   →  dynamic support
What it tells you. Wide bands = volatile market. Narrow bands = compressed, quiet market. A squeeze (bands narrowing to their tightest in months) often precedes a sharp directional breakout — though the direction cannot be determined from the squeeze alone.
Adapts to N_DAYS:
| Window | Bollinger base |
|---|---|
| ≤ 180 days | BB(20) — 20-day SMA and standard deviation |
| > 180 days | BB(50) — 50-day SMA and standard deviation |
3 · MACD — Moving Average Convergence Divergence
What it is. Measures momentum by subtracting a slow EMA from a fast EMA.
MACD Line   = EMA(12) − EMA(26)
Signal Line = EMA(9) of MACD
What it tells you.
- MACD above Signal → bullish crossover (momentum building upward)
- MACD below Signal → bearish crossover (momentum building downward)
- Both lines above zero → overall upward trend in force
- Both lines below zero → overall downward trend in force
- Gap widening → momentum accelerating; gap narrowing → momentum fading
The code checks whether the MACD–Signal gap has been widening or narrowing over the last 3 sessions, providing directional context beyond the simple crossover.
4 · RSI — Relative Strength Index
What it is. Measures the speed and magnitude of price changes on a 0–100 scale, using Wilder’s original 1978 exponential smoothing formula:
alpha = 1/N,   adjust=False   (Wilder's exact recursive formula)
RSI = 100 − (100 / (1 + avg_gain / avg_loss))
This matches the values produced by TradingView, Bloomberg, and Reuters precisely.
What it tells you. RSI above the overbought threshold suggests the asset is statistically stretched upward and may mean-revert. RSI below the oversold threshold suggests exhaustion of sellers and a potential bounce. RSI = 50 is neutral.
Adapts to N_DAYS:
| Window | RSI period | Overbought / Oversold |
|---|---|---|
| ≤ 180 days | RSI(14) | 70 / 30 — classic Wilder thresholds |
| > 180 days | RSI(21) | 65 / 35 — smoother, fewer false signals |
The code checks the 3-session trend of RSI to distinguish one-day noise from sustained momentum shifts.
5 · Fibonacci Retracements
What it is. Horizontal price levels derived from Fibonacci ratios (0.236, 0.382, 0.5, 0.618), drawn between the window’s peak and trough.
What it tells you. These levels mark where buyers commonly re-enter during pullbacks in an uptrend, or where sellers commonly appear during rallies in a downtrend. The 61.8% level (the “golden ratio”) is the deepest common retracement in a healthy trend — breaking below it often signals a trend reversal.
| Level | Interpretation |
|---|---|
| 23.6% | Shallow retracement — trend remains very strong |
| 38.2% | Moderate retracement — trend still intact |
| 50.0% | Midpoint — psychologically important round number |
| 61.8% | Deepest healthy retracement — critical support/resistance |
Fibonacci levels are shown only for N_DAYS ≥ 180, where there is enough price history to make the peak-to-trough calculation meaningful.
6 · Monte Carlo Simulation (Geometric Brownian Motion)
What it is. 200 simulated price paths over the next 90 trading days, using the Geometric Brownian Motion model with the Itô correction:
P(t) = P(t−1) × exp( (μ − 0.5σ²) + σ × Z ) where Z ~ N(0,1)
The full download history (not just N_DAYS) is used to calibrate μ (drift) and σ (volatility) so the estimates are based on as many observations as possible.
What it shows. The 5%–95% band captures 90% of all simulations. The mean path shows the expected drift. Wider bands mean higher historical volatility and more uncertainty — not a worse model, just an honest representation of the asset’s own history.
Important caveat. GBM assumes constant volatility and normally distributed returns. Real markets have fat tails, volatility clustering, and regime changes. The chart is a probability distribution, not a price forecast.
7 · ATR — Average True Range
What it is. Measures the average size of a single day’s price movement in price units, using Wilder’s smoothing (alpha = 1/14):
True Range = max( High−Low,  |High−PrevClose|,  |Low−PrevClose| )
ATR(14)    = Wilder-smoothed average of True Range
ATR%       = ATR / Close × 100   (comparable across assets)
What it tells you.
- High ATR → large daily swings; volatile, fearful market
- Low ATR → small daily swings; quiet, compressed market
- Rising ATR in a trend → trend has institutional participation and conviction
- Falling ATR in a trend → momentum fading, trend may be ending
Practical uses the code explains: stop-loss placement (1.5–2× ATR below entry) and the OBV divergence threshold (calibrated to each asset’s own ATR%, not a fixed percentage — a 2% move is unremarkable for BTC but significant for the S&P 500).
8 · OBV — On-Balance Volume
What it is. A cumulative volume indicator that adds volume on up days and subtracts it on down days:
OBV(t) = OBV(t−1) + Volume   if Close > Close(t−1)
OBV(t) = OBV(t−1) − Volume   if Close < Close(t−1)
What it tells you. OBV reveals whether volume is flowing into or out of an asset — something that raw price bars cannot tell you by themselves. The absolute level is irrelevant; only the direction and divergence from price matter.
The most powerful signal — divergence:
- Price rises to a new high but OBV does not → volume is not confirming the breakout → bearish divergence
- Price falls to a new low but OBV does not → buyers are absorbing selling → bullish divergence
The code detects divergence using an ATR-normalised threshold so the signal is calibrated to each asset’s own volatility. It also detects conflicts between the full-window OBV trend and the recent OBV-vs-SMA signal, and explains the time-scale difference explicitly rather than presenting contradictory statements.
9 · Stochastic Oscillator (%K / %D)
What it is. Measures where the current close sits within the recent high-low range:
%K = (Close − Lowest Low₁₄) / (Highest High₁₄ − Lowest Low₁₄) × 100
%D = 3-day SMA of %K   (the signal line)
What it tells you. %K near 100 → price at the top of its 14-day range (overbought). %K near 0 → price at the bottom (oversold). The %K/%D crossover below 20 is a strong buy signal; above 80 a strong sell signal.
Key distinction from RSI:
| Indicator | Measures |
|---|---|
| RSI | Velocity — how fast is price moving? |
| Stochastic | Position — where is price in its recent range? |
When both RSI and Stochastic are simultaneously overbought or oversold, the signal carries double confirmation and the code flags this explicitly.
10 · ADX — Average Directional Index with +DI / −DI
What it is. Measures trend strength, not direction. Based on Wilder’s full Directional Movement System (1978), implemented with Wilder’s exact ewm smoothing (alpha = 1/14) throughout all three steps — matching TradingView, MetaTrader, and Bloomberg values precisely.
+DI = 100 × Wilder(+DM) / Wilder(ATR)
−DI = 100 × Wilder(−DM) / Wilder(ATR)
DX  = |+DI − −DI| / (+DI + −DI) × 100
ADX = Wilder-smoothed DX
What ADX tells you:
| ADX value | Interpretation |
|---|---|
| < 20 | No meaningful trend — market is ranging and choppy |
| 20–25 | Trend beginning to form — use caution |
| 25–50 | Strong, well-established, tradeable trend |
| > 50 | Extremely strong trend — often near exhaustion |
ADX is direction-neutral: a sharp rally and a sharp crash both produce high ADX. The +DI/−DI lines provide direction: +DI > −DI = upward pressure dominant; −DI > +DI = downward pressure dominant.
How the analysis adapts to N_DAYS
Every indicator, chart, and scoring weight adapts automatically when you change the time window. This is the core design principle: a 90-day short-term analysis should use different tools and different emphasis than a 730-day multi-year structural analysis.
Indicator configuration by window
| N_DAYS | Candle type | SMA pair | Bollinger | RSI | OB / OS | Fibonacci | Regression channel |
|---|---|---|---|---|---|---|---|
| ≤ 90 | Daily | SMA 20 / 50 | BB(20) | RSI-14 | 70 / 30 | No | No |
| ≤ 180 | Daily | SMA 50 / 100 | BB(20) | RSI-14 | 70 / 30 | Yes | Yes |
| ≤ 365 | Daily | SMA 50 / 200 | BB(50) | RSI-21 | 65 / 35 | Yes | Yes |
| > 365 | Weekly | SMA 50 / 200 | BB(50) | RSI-21 | 65 / 35 | Yes | Yes |
Adaptive scoring weights by window
The six analytical sections are combined using a weighted average. The weights themselves change with the time horizon, reflecting a core principle: momentum oscillators are most useful at short windows; trend signals become increasingly reliable as the window grows.
| Section | ≤ 90 days | ≤ 180 days | ≤ 365 days | > 365 days | Why it changes |
|---|---|---|---|---|---|
| Trend (SMA · Death Cross) | 25% | 28% | 30% | 33% | SMA crossovers carry more weight at longer horizons — a Death Cross on the weekly is a major institutional signal |
| Momentum (RSI · Stoch · MACD) | 30% | 27% | 25% | 20% | Oscillators are most responsive short-term; at weekly resolution they oscillate freely even in strong trends |
| Trend Strength (ADX · DI) | 18% | 19% | 20% | 22% | ADX needs many bars to converge reliably; it is most dependable at longer windows |
| Volume & Flow (OBV) | 15% | 15% | 15% | 15% | Volume confirmation is equally important at every horizon |
| Drawdown & Position | 8% | 8% | 8% | 8% | Context only — not a forward-looking directional signal |
| Volatility (BB · ATR) | 4% | 3% | 2% | 2% | Bollinger Squeezes are a short-term concept; irrelevant at multi-year horizons |
All weights sum to 100% in every configuration.
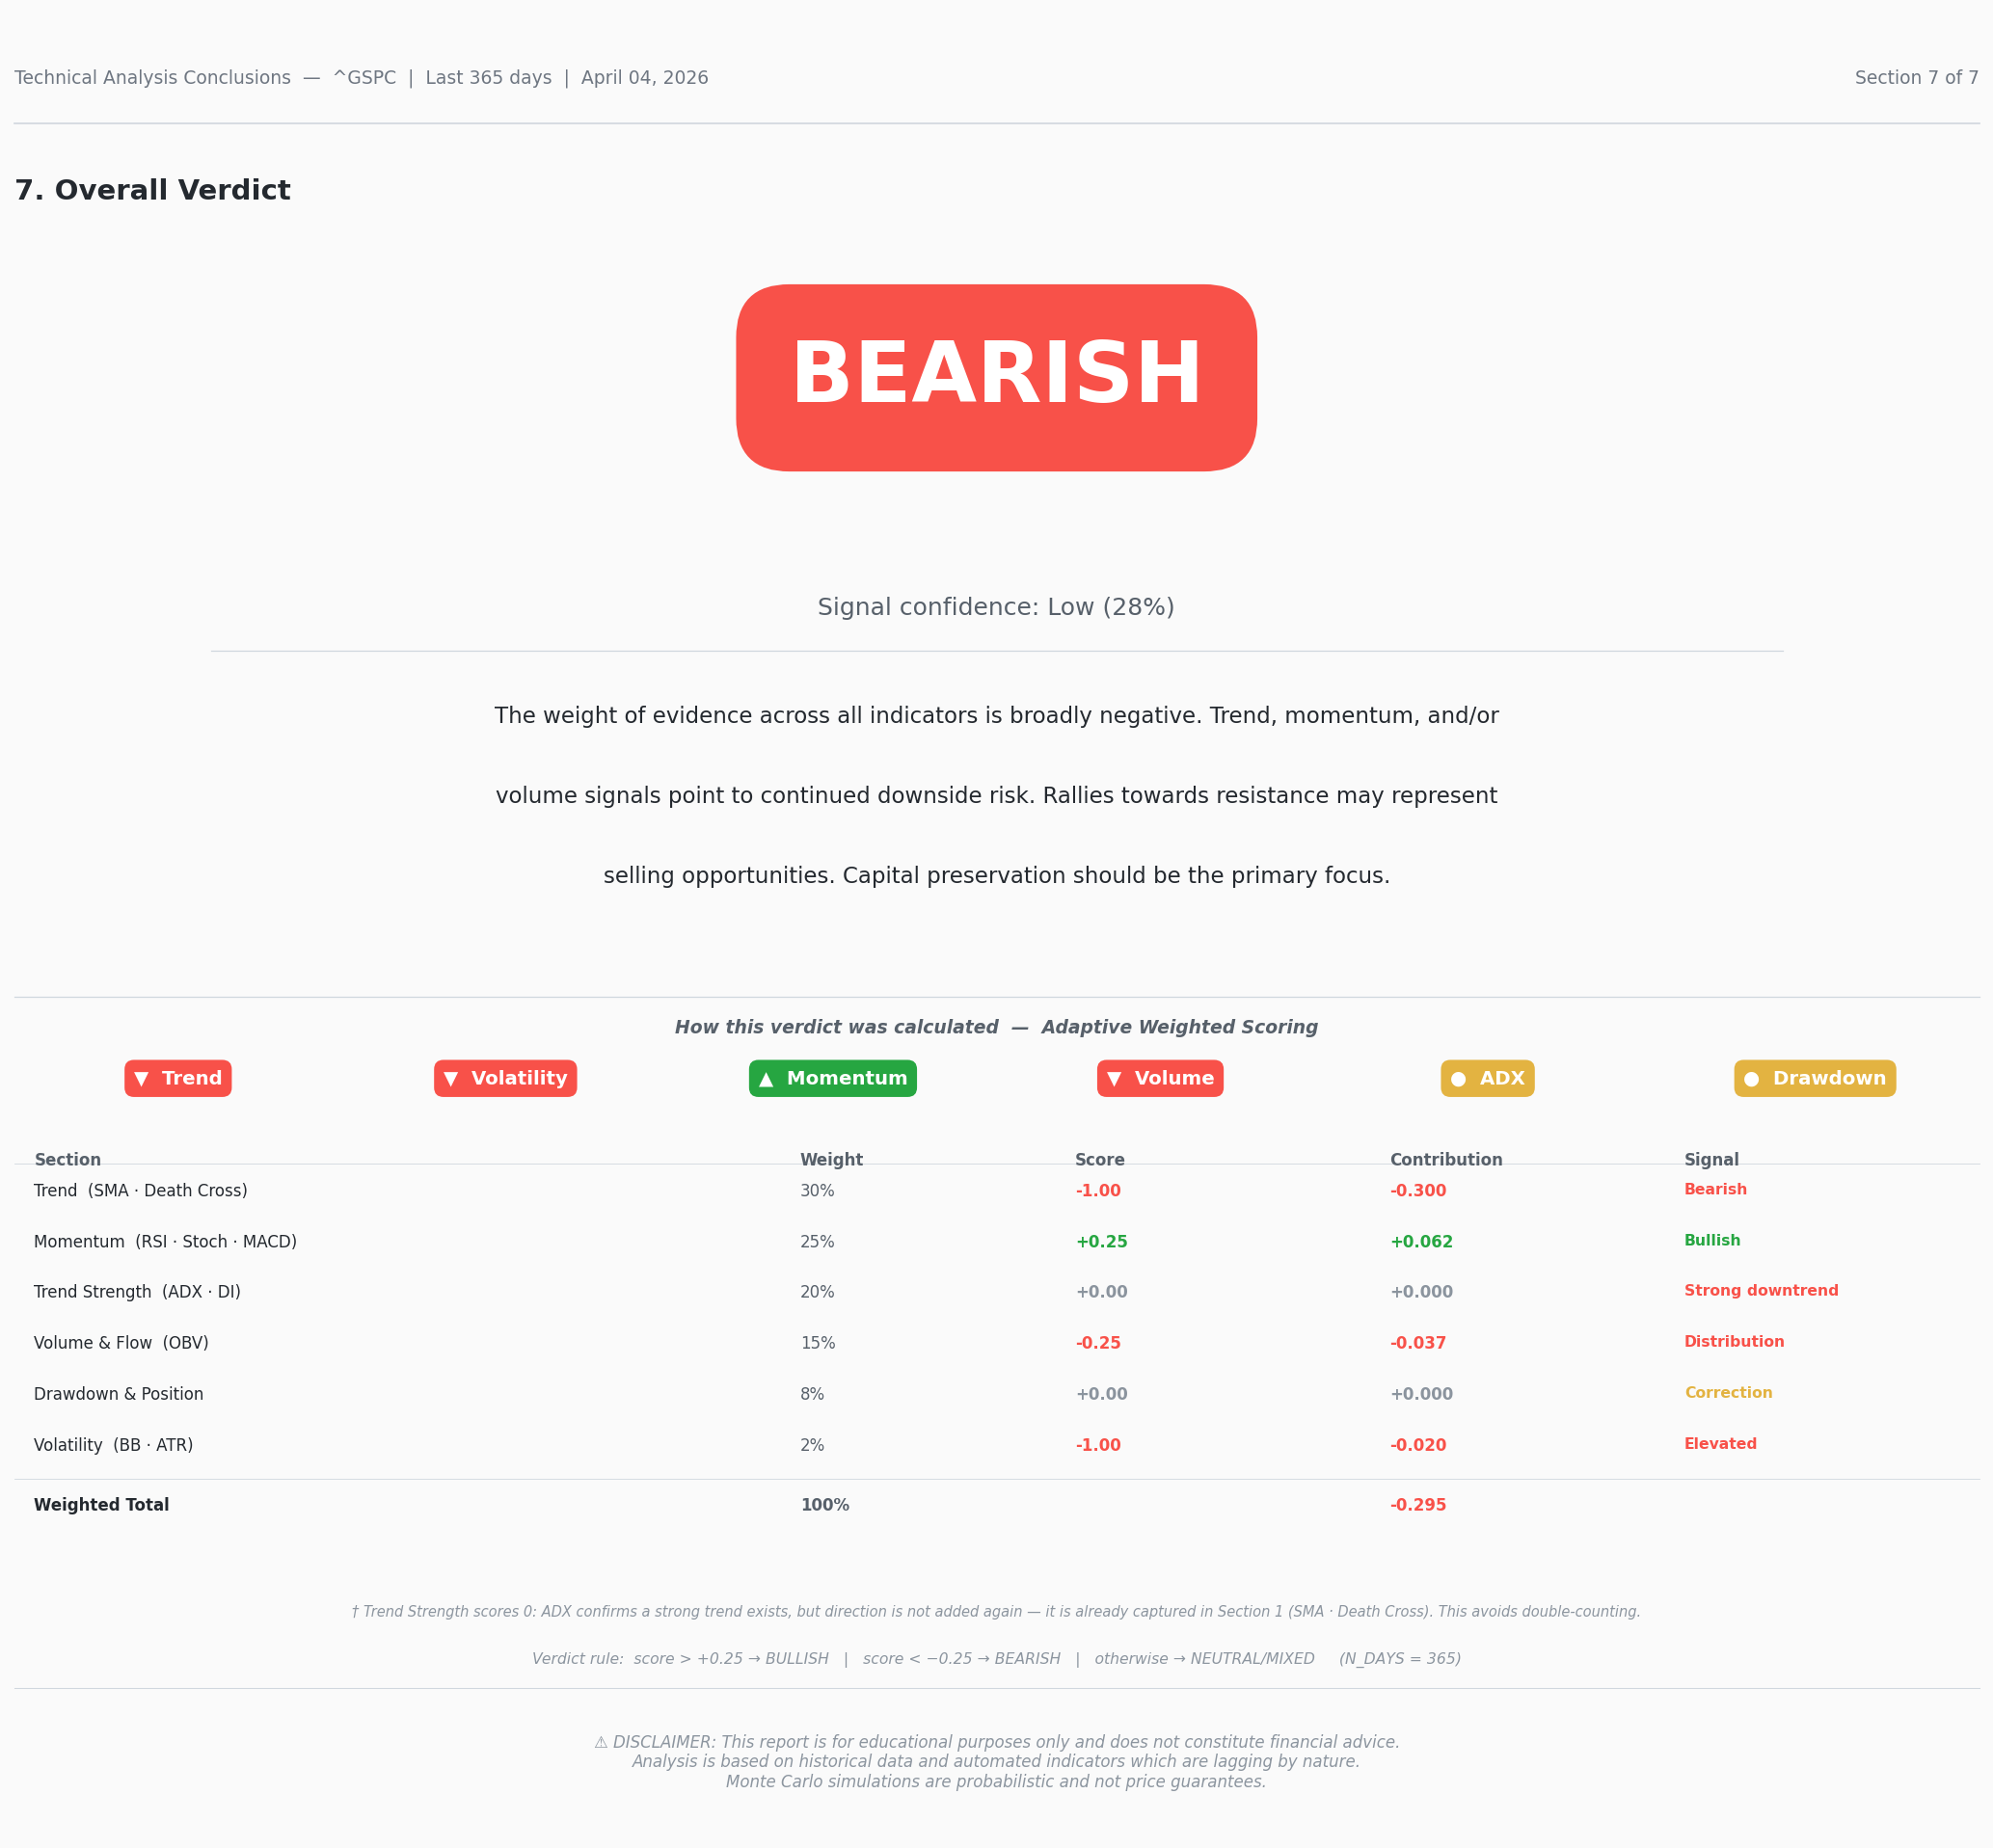
The Overall Verdict and how to read it
The final page of every report shows the Overall Verdict: BULLISH, BEARISH, or NEUTRAL / MIXED. This is not a black box — the methodology table on that page shows every number used to arrive at it.
The verdict rule
Weighted score > +0.25  →  BULLISH
Weighted score < −0.25  →  BEARISH
Otherwise               →  NEUTRAL / MIXED
The methodology table
Each of the six sections produces a normalised score between −1.0 (fully bearish) and +1.0 (fully bullish). The table shows, for each section, the weight applied for the chosen N_DAYS, the normalised score, the weighted contribution, and the signal label. The weighted total is the number the verdict rule is applied to.
Example table for ^GSPC, N_DAYS = 365 — generated April 04, 2026 at 07:08 PM:
| Section | Weight | Score | Contribution | Signal |
|---|---|---|---|---|
| Trend (SMA · Death Cross) | 30% | −1.00 | −0.300 | Bearish |
| Momentum (RSI · Stoch · MACD) | 25% | +0.25 | +0.062 | Bullish |
| Trend Strength (ADX · DI) | 20% | +0.00 | +0.000 | Strong downtrend |
| Volume & Flow (OBV) | 15% | −0.25 | −0.037 | Distribution |
| Drawdown & Position | 8% | +0.00 | +0.000 | Correction |
| Volatility (BB · ATR) | 2% | −1.00 | −0.020 | Elevated |
| Weighted Total | 100% | −0.295 | BEARISH |
Note: Trend Strength scores +0.00 because ADX strength (+1) and the bearish DI direction (−1) cancel mathematically. This is intentional — direction is already fully captured in Section 1 (SMA · Death Cross), so adding it again here would double-count the bearish signal. The † footnote on the report’s verdict page explains this explicitly.
Signal confidence
The confidence percentage expresses how far the weighted score is from the verdict threshold:
- At the threshold (±0.25): confidence = 25% Low
- At ±0.50 (indicators broadly agree): confidence ≈ 46% Moderate
- At ±0.75: confidence ≈ 64% High
- Maximum is capped at 90% — there is never absolute certainty in markets
What this framework is and what it is not
Every report carries this disclaimer, and it is worth stating clearly here too:
This analysis is based on historical data and automated indicators which are lagging by nature. All indicators describe what has already happened — they do not predict what will happen next. The Overall Verdict is a structured summary of current technical evidence, not a buy or sell recommendation. Monte Carlo simulations are probabilistic and not price guarantees.
Technical analysis is a structured way to read price history. Its value lies in consistency, transparency, and discipline — not in predicting the future. Every number in these reports is verifiable from publicly available market data using standard, industry-accepted formulas.
What comes next
In the posts that follow I will share regular reports applying this framework to specific tickers and time windows. For each report I will share:
- The full 19-page PDF
- Selected individual charts as PNG images
- A brief commentary on the most significant signals in that particular report
The code behind all of this is written in Python using yfinance, pandas, numpy, and matplotlib. All indicator formulas follow the original 1978 Wilder specifications where applicable, verified against TradingView and Bloomberg outputs.
Full 19-page technical report attached below for the Example table: ^GSPC, N_DAYS = 365 — generated April 04, 2026 at 07:08 PM. 👇
Generated with Python and matplotlib · @lbarqueira.bsky.social