What technical indicators to look at for index ETF prediction on next day, next week and next month investment — a Machine Learning analysis
If you have ever stared at a chart full of indicators — moving averages, RSI, MACD, volume bars — and wondered which ones actually matter for the decision you are trying to make, this post is for you. The answer, it turns out, depends almost entirely on how long you plan to hold.
I trained machine learning models on five major UCITS index ETFs traded on XETRA and asked a direct question: which technical indicators are the most important predictors of direction at the next-day, next-week, and next-month horizons? The models were given no prior knowledge of trading rules. They discovered the answer from the data alone.
What they found is both surprising in its clarity and reassuring in its consistency with what experienced investors have long believed.
The eight indicators tested
All features were computed purely from daily price and volume history — no fundamental data, no macro indicators, no news sentiment:
| Feature | What it measures | Timescale |
|---|---|---|
price_change |
Day-over-day % change in adjusted close | Very short |
volume_change |
Day-over-day % change in trading volume | Very short |
day_gain |
Intraday move from open to close | Very short |
50SMA |
Price divided by 50-day moving average | Medium |
200SMA |
Price divided by 200-day moving average | Long |
RSI |
Relative Strength Index (0–100) | Medium |
MACD |
12-period EMA minus 26-period EMA | Medium |
MACD_Signal |
9-day EMA of the MACD line | Medium |
The SMA features were expressed as ratios — price divided by the moving average — rather than raw dollar values. A ratio above 1.0 means the price is above its moving average; below 1.0 means below. This makes the feature meaningful regardless of the absolute price level and independent of time period.
The five ETFs analysed were SXR8.DE (S&P 500), IS3N.DE (Emerging Markets), SXRV.DE (NASDAQ 100), VWCE.DE (FTSE All-World), and EUNL.DE (MSCI World), all on XETRA in euros.
What to look at for each horizon
Next day — no single indicator stands out
At the daily horizon the feature importance charts are almost flat. No single indicator dominates. day_gain, volume_change, price_change, RSI, and MACD all contribute at similar modest levels. The models achieve accuracy in the range of 0.53–0.57 — barely above the 0.50 coin-flip baseline.
What this means for you: daily price movements are dominated by noise that no technical indicator can reliably penetrate. If you must look at something for a very short-term view, price_change and volume_change together carry the most signal — a price increase confirmed by rising volume is the closest thing to a next-day bullish signal this model can offer. But the confidence should be low. At this horizon, technical analysis is operating at the edge of its usefulness.
For next-day decisions: no indicator provides reliable signal. If pressed, watch price_change and volume_change together — but treat any signal with low conviction.
Next week — the 200SMA takes the lead, MACD confirms
At the weekly horizon the picture sharpens noticeably. The 200SMA ratio emerges as the leading feature, with MACD and MACD_Signal contributing meaningfully alongside it. RSI adds moderate value. Short-term features like day_gain and price_change begin to fade.
Model accuracy rises to 0.55–0.63 across the five ETFs. This is a meaningful improvement over the daily horizon and represents a real, if modest, edge.
The reason the 200SMA starts asserting itself even at the weekly horizon is that five trading days is long enough for trend momentum to matter. A price that is significantly above its 200-day average tends to continue in the direction of that trend over the following week more often than not. MACD and MACD_Signal capture shorter-term momentum oscillations that are meaningful at this timescale — their 12, 26, and 9-day windows align naturally with a weekly prediction target.
What this means for you: for a weekly positioning decision, the most important question to ask is whether the ETF is above or below its 200-day moving average. If the 200SMA ratio is above 1.0, the weekly trend is more likely to continue upward. Confirm with MACD: when the MACD line is above its signal line, weekly momentum is bullish. RSI values below 30 suggest an oversold condition that may be due for a bounce; above 70 suggest caution.
For next-week decisions: check the 200SMA ratio first. Confirm with MACD crossover direction. Use RSI as a secondary filter for overbought and oversold extremes.
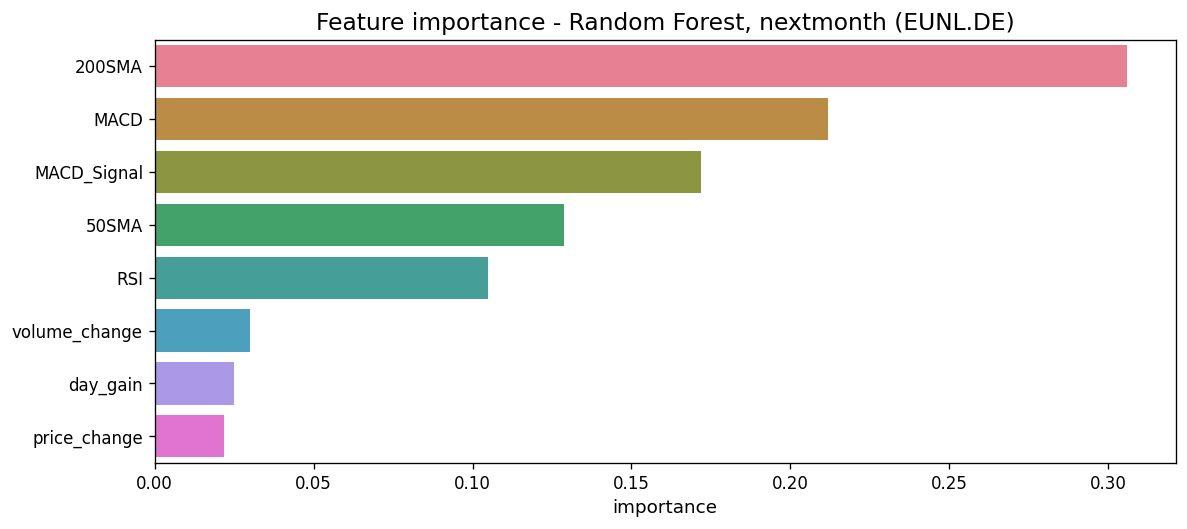
Next month — 200SMA dominates, everything else is secondary
At the monthly horizon the picture becomes strikingly clear and consistent across all five ETFs and both models. The 200SMA ratio is the single most important feature by a wide margin. The 50SMA acts as a secondary confirmation layer. All other features — RSI, MACD, price_change, volume_change, day_gain — shrink to minor or negligible roles.
This is the strongest and most consistent finding in the entire study. Model accuracy rises to 0.58–0.71, with EUNL.DE (iShares Core MSCI World) achieving the best result at 71.1% accuracy and F1 of 0.821.
The reason is structural. The 200-day moving average smooths out 40 weeks of price history. It filters out short-term volatility entirely and captures only the underlying directional trend. At a monthly prediction horizon, the model has learned that what matters is not what happened yesterday, last week, or even in the last month — it is whether the ETF is in a sustained uptrend or downtrend relative to its long-term average. Everything else is noise at this timescale.
The 50SMA ratio adds value as a confirmation: when both the 50SMA and 200SMA ratios are above 1.0 simultaneously — meaning the price is above both its medium and long-term averages — the model’s confidence in an upward month is at its highest. This is the configuration known in technical analysis as a bullish alignment, and the data confirms it deserves that name.
What this means for you: for a monthly investment decision, the analytical process is simple. Check whether the ETF price is above its 200-day moving average. If yes, the model’s best guess is continued upward movement. Confirm with the 50SMA. Ignore the daily oscillators — RSI, MACD, intraday candles — at this horizon. They are noise, and looking at them adds no predictive value according to the model.
For next-month decisions: the 200SMA ratio is the only indicator that consistently matters. If price is above the 200SMA (ratio > 1.0), the model favours upward continuation. Confirm with 50SMA. Ignore everything else.
A visual summary
| Horizon | #1 indicator | #2 indicator | Indicators to ignore | RF Accuracy range |
|---|---|---|---|---|
| Next day | None dominant | None dominant | — | 0.53–0.57 |
| Next week | 200SMA ratio | MACD / MACD_Signal | day_gain, price_change | 0.55–0.63 |
| Next month | 200SMA ratio | 50SMA ratio | RSI, MACD, volume_change, day_gain, price_change | 0.58–0.71 |
The deeper finding: ML proves what practitioners already knew
The most intellectually interesting result of this study is not any individual number. It is the fact that a machine learning model — given raw price and volume data and no prior knowledge of trading rules — independently rediscovered the 200-day moving average as the dominant signal for monthly ETF direction.
Experienced investors have known this for decades. It appears on every charting platform and in every trading textbook. It is passed down as received wisdom. What this study adds is something different: it shows empirically, from the data itself, that this wisdom is justified. Not as tradition. Not as convention. As a measurable, quantifiable predictive signal that survives rigorous out-of-sample testing.
The study also adds nuance. The 200SMA dominance holds most strongly for broad, liquid, developed-market ETFs — EUNL.DE, SXR8.DE, SXRV.DE. It is weaker for emerging markets (IS3N.DE), where geopolitical events, currency movements, and commodity cycles introduce noise that price and volume data cannot capture. And it breaks down almost entirely at the daily horizon, where short-term noise overwhelms any trend signal.
The limitations you should keep in mind
Presenting these results without the limitations would be misleading, so here they are plainly.
The accuracy is real but modest. Even 71.1% accuracy means the model is wrong 3 times in 10. It is an edge, not a guarantee.
The training window is a bull market. The last 10 years include two significant drawdowns but a broadly rising market overall. The models have learned to codify bullish trend-following. In a prolonged bear market, accuracy would likely be lower.
Direction is not the same as return. A correct “up” prediction when the market rises 0.1% is not the same as a correct “up” prediction when the market rises 5%. The model does not distinguish between these. A small edge in direction prediction may not translate to a proportional edge in portfolio return.
The F1 scores are inflated by upward bias. Because the training window has more up-days than down-days, the models are biased toward predicting “up.” They are more reliable at confirming uptrends than at identifying downturns — which is precisely when you most need a signal.
How to use this in practice
Think of the 200SMA as a traffic light for monthly positioning, not a precise entry signal.
Green light: ETF price is above the 200SMA (ratio > 1.0), and 50SMA ratio is also above 1.0. Both moving averages are rising. The model’s best guess is continued upward movement. Hold or add to position.
Amber light: ETF price is above the 200SMA but 50SMA ratio has recently crossed below 1.0, or MACD is showing negative divergence. Trend is intact but momentum is weakening. Reduce position size or set tighter stops.
Red light: ETF price is below the 200SMA (ratio < 1.0). The model’s confidence in an upward month drops significantly. Reduce or exit the position, or at minimum do not add to it.
This framework works best on the broader, more diversified ETFs in this universe — EUNL.DE and SXR8.DE in particular. Apply it with more caution on IS3N.DE, where the 200SMA signal is less reliable, and always combine it with your broader investment thesis and risk management rules.
The model is one input. Not the only input. Not the most important input in a bear market. But a quantitatively validated, data-driven input that now has more than practitioner intuition behind it.
Download the full report
The complete technical report — including all 32 feature importance charts, the full summary table with accuracy and F1 scores for all five ETFs across all three horizons, and the detailed methodology — is available as a PDF:
👉 Download the full technical report (PDF) - April 14, 2026
All analysis is for educational purposes only and does not constitute financial advice. Past predictability does not guarantee future results.