S&P 500 (^GSPC) - Financial Analysis - V
The “Complete Picture”: Price Action + Market Conviction
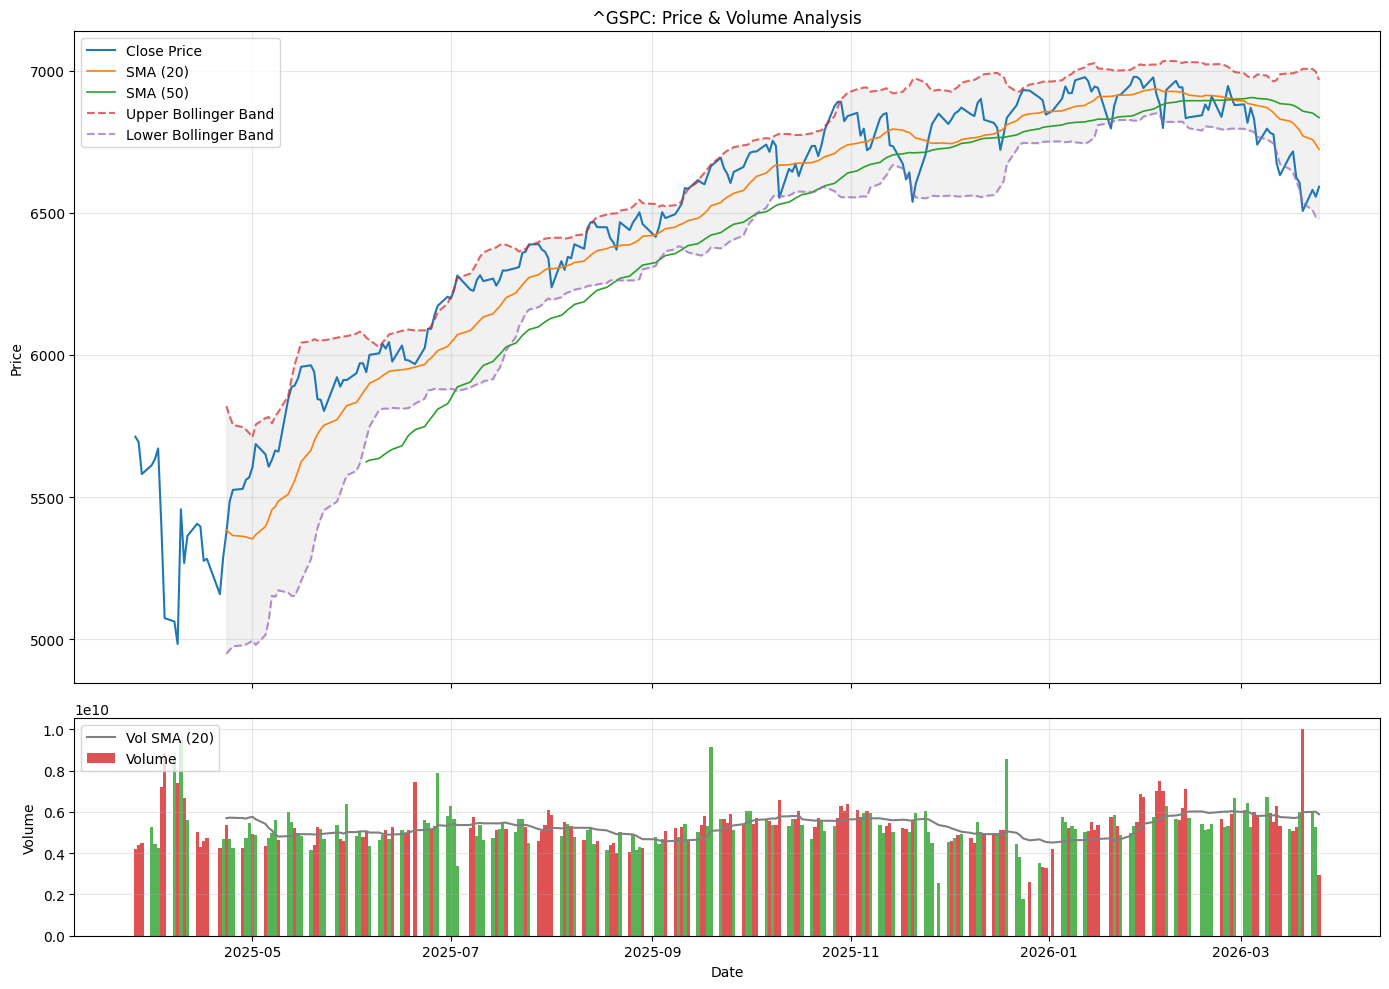
While our previous analysis S&P 500 (^GSPC) - Financial Analysis - I) focused on trend and volatility, this new dual-panel chart introduces Volume—the lifeblood of the market. By aligning price and volume, we can now see the “Institutional Footprint” behind every move.
1. Price, Trends, and Volatility (Top Panel)
We maintain our core technical indicators to keep our “Trend and Volatility” context:
-
SMA (20 & 50): These remain our primary trend filters.
-
Bollinger Bands: Our volatility “corridor.”
-
Consistency: The colors remain identical to our previous reports (Blue for Price, Orange/Green for SMAs) to ensure a seamless transition for our long-term analysis.
2. Introducing the Volume Engine (Bottom Panel)
This is where the real “detective work” happens. The bottom panel displays the number of shares traded, providing the Validation for the price action above.
-
Color-Coded Conviction: * Green Bars: Indicate “Accumulation.” Buying pressure was dominant, driving the price higher than it opened.
- Red Bars: Indicate “Distribution.” Selling pressure was dominant, pushing the price below its opening.
-
Volume SMA (The Gray Line): This represents the “Normal” activity level (20-day average).
-
High Activity: Bars that break above this line indicate significant events or institutional participation.
-
Low Activity: Bars below this line suggest the current move lacks conviction and might be “retail noise.”
-
3. How to Read the “New” Signals
With this integrated view, we look for two specific high-value signals:
-
The Confirmed Breakout: If the price breaks the Upper Bollinger Band (Top) and we see a massive Green Volume Bar (Bottom), it is a high-probability buy signal. It shows that “Big Money” is buying the breakout.
-
The Divergence Warning: If the price hits a new high but the Volume Bars are getting smaller, it’s a warning. The trend is “running on fumes.” Without volume to support the price, a reversal toward the SMA 20 is likely.
Why this upgrade matters for our analysis:
Technical analysts often say, “Volume precedes price.” By adding this chart to our report, we aren’t just looking at where the S&P 500 is—we are measuring the strength of the engine pushing it there.