Technical Report: S&P 500 (^GSPC) – April 18, 2026, 10:35 PM
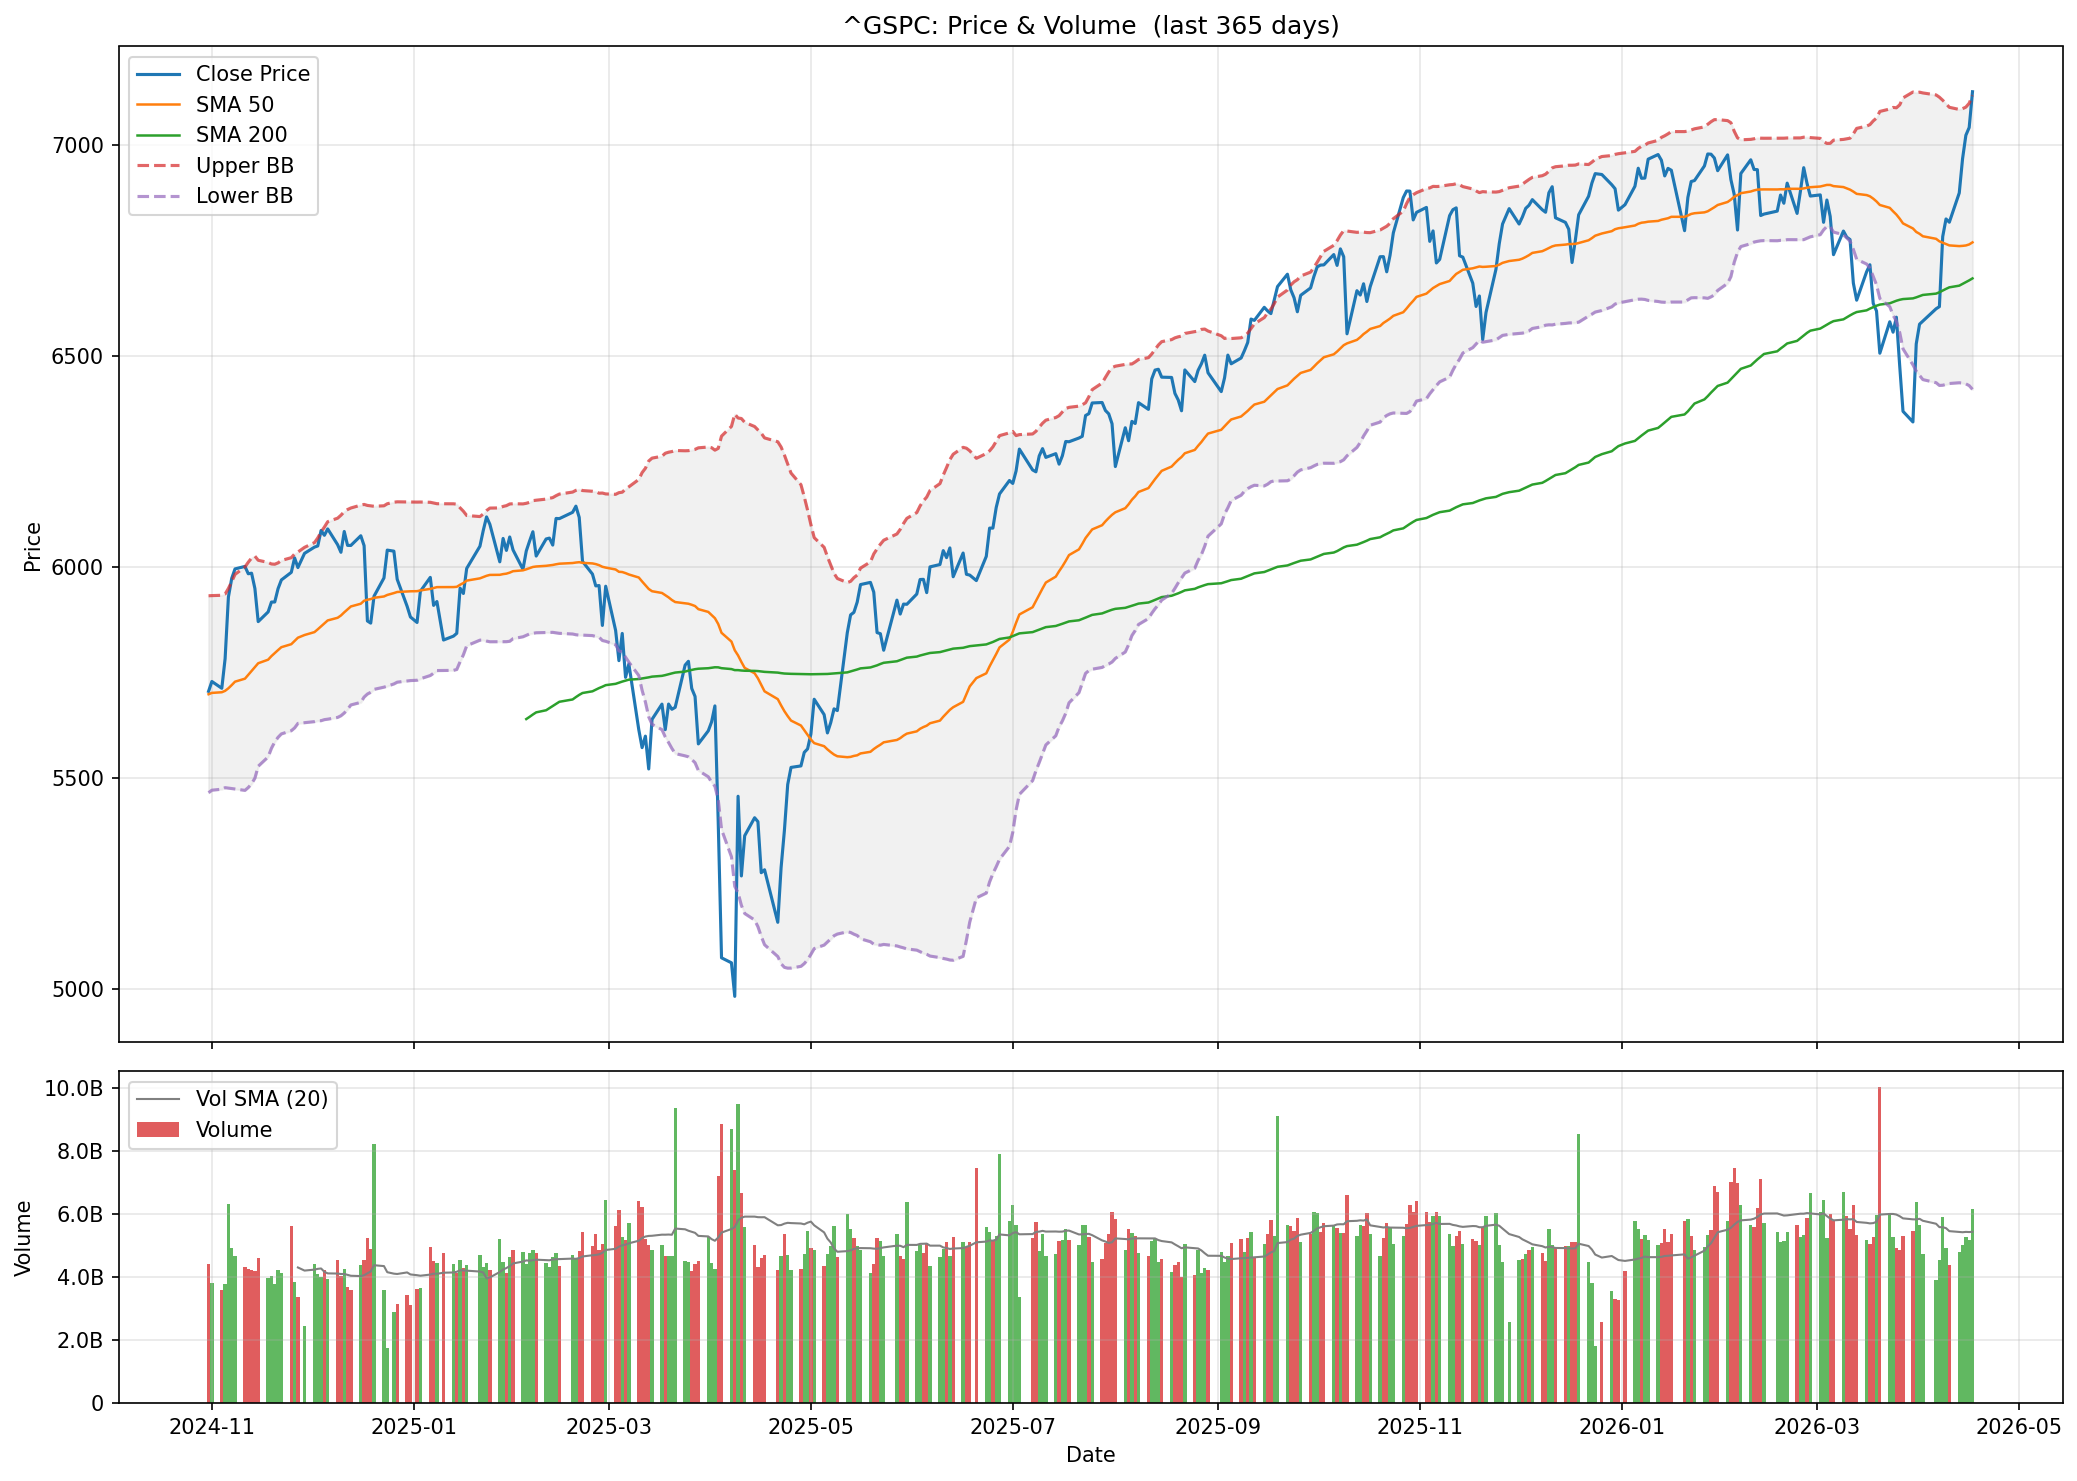
Following the Technical Analysis Framework introduced previously, this post provides the detailed results for the S&P 500 (^GSPC) over a 365-day analysis window.
The report processed today reinforces the bullish outlook identified last week, with the scoring engine showing increased momentum in the structural trend.
Technical Summary
The analysis has returned a BULLISH verdict. The weighted score has improved from +0.274 last week to a more robust +0.369.
- Overall Verdict: BULLISH
- Signal Confidence: 35% (Low)
- Weighted Total Score: +0.369
- Max Drawdown (365d): 32.4%
Adaptive Weighted Scoring Analysis
The logic for a 365-day window focuses on structural health and institutional volume flow.
| Section | Weight | Score | Contribution | Signal |
|---|---|---|---|---|
| Trend (SMA · Death Cross) | 30% | +0.33 | +0.100 | Bullish |
| Momentum (RSI · Stoch · MACD) | 25% | -0.33 | -0.083 | Bearish |
| Trend Strength (ADX · DI) | 20% | +1.00 | +0.200 | Strong uptrend |
| Volume & Flow (OBV) | 15% | +0.75 | +0.112 | Accumulation |
| Drawdown & Position | 8% | +0.50 | +0.040 | Minor Pullback |
| Volatility (BB · ATR) | 2% | +0.00 | +0.000 | Normal |
| Weighted Total | 100% | +0.369 | BULLISH |
Primary Signals Identified
1. Dominant Trend Strength
The most significant shift is the Trend Strength contribution of +0.200. With an ADX of 27.6, the index is in a well-established, tradeable trend. While a “Death Cross” remains active (SMA 20 is 1.16% below SMA 50), the price remains 6.6% above the 200-day SMA, supporting a long-term bull market structure.
2. Stretched Momentum
Momentum has moved into Bearish territory (-0.33) due to extreme overbought readings. The RSI 21 stands at 66.1, and the Stochastic %K has reached 97.4, placing price at the very top of its 14-day range. This “double overbought” signal suggests the price is statistically stretched.
3. Institutional Accumulation
The Volume & Flow score remains at +0.75, indicating consistent support. On-Balance Volume (OBV) is currently above its 20-day SMA, with a 316.4% rise over the 365-day window, confirming that buying pressure continues to outweigh selling pressure.
4. Normalizing Volatility
Volatility has stabilized to a “Normal” rating (0.00). While Bollinger Band width remains elevated at 13.62%, the ATR (14) of 91.91 (1.29% of price) suggests daily swings are becoming consistent with current market norms.
Full 19-page Technical Report
The complete 19-page report includes Monte Carlo simulations (200 paths), Fibonacci retracement levels for the 365-day range, and detailed momentum oscillators.
👉 Download Full PDF Report: ^GSPC 365d - April 18, 2026
Generated with Python and matplotlib · @lbarqueira.bsky.social
Disclaimer: This report is for educational purposes only and does not constitute financial advice. Analysis is based on historical data and automated indicators which are lagging by nature. Monte Carlo simulations are probabilistic and not price guarantees.