Technical Report: S&P 500 (^GSPC) – April 11, 2026, 07:31 PM
Following the Technical Analysis Framework introduced previously, this post provides the detailed results for the S&P 500 (^GSPC) over a 365-day analysis window.
The report processed today signals a change in the market’s technical structure compared to previous readings, moving into a territory that the engine classifies as bullish.
Technical Summary
The analysis has returned a BULLISH verdict. The weighted score has moved from the negative values observed last week to a positive +0.274.
- Overall Verdict: BULLISH
- Signal Confidence: 27% (Low)
- Weighted Total Score: +0.274
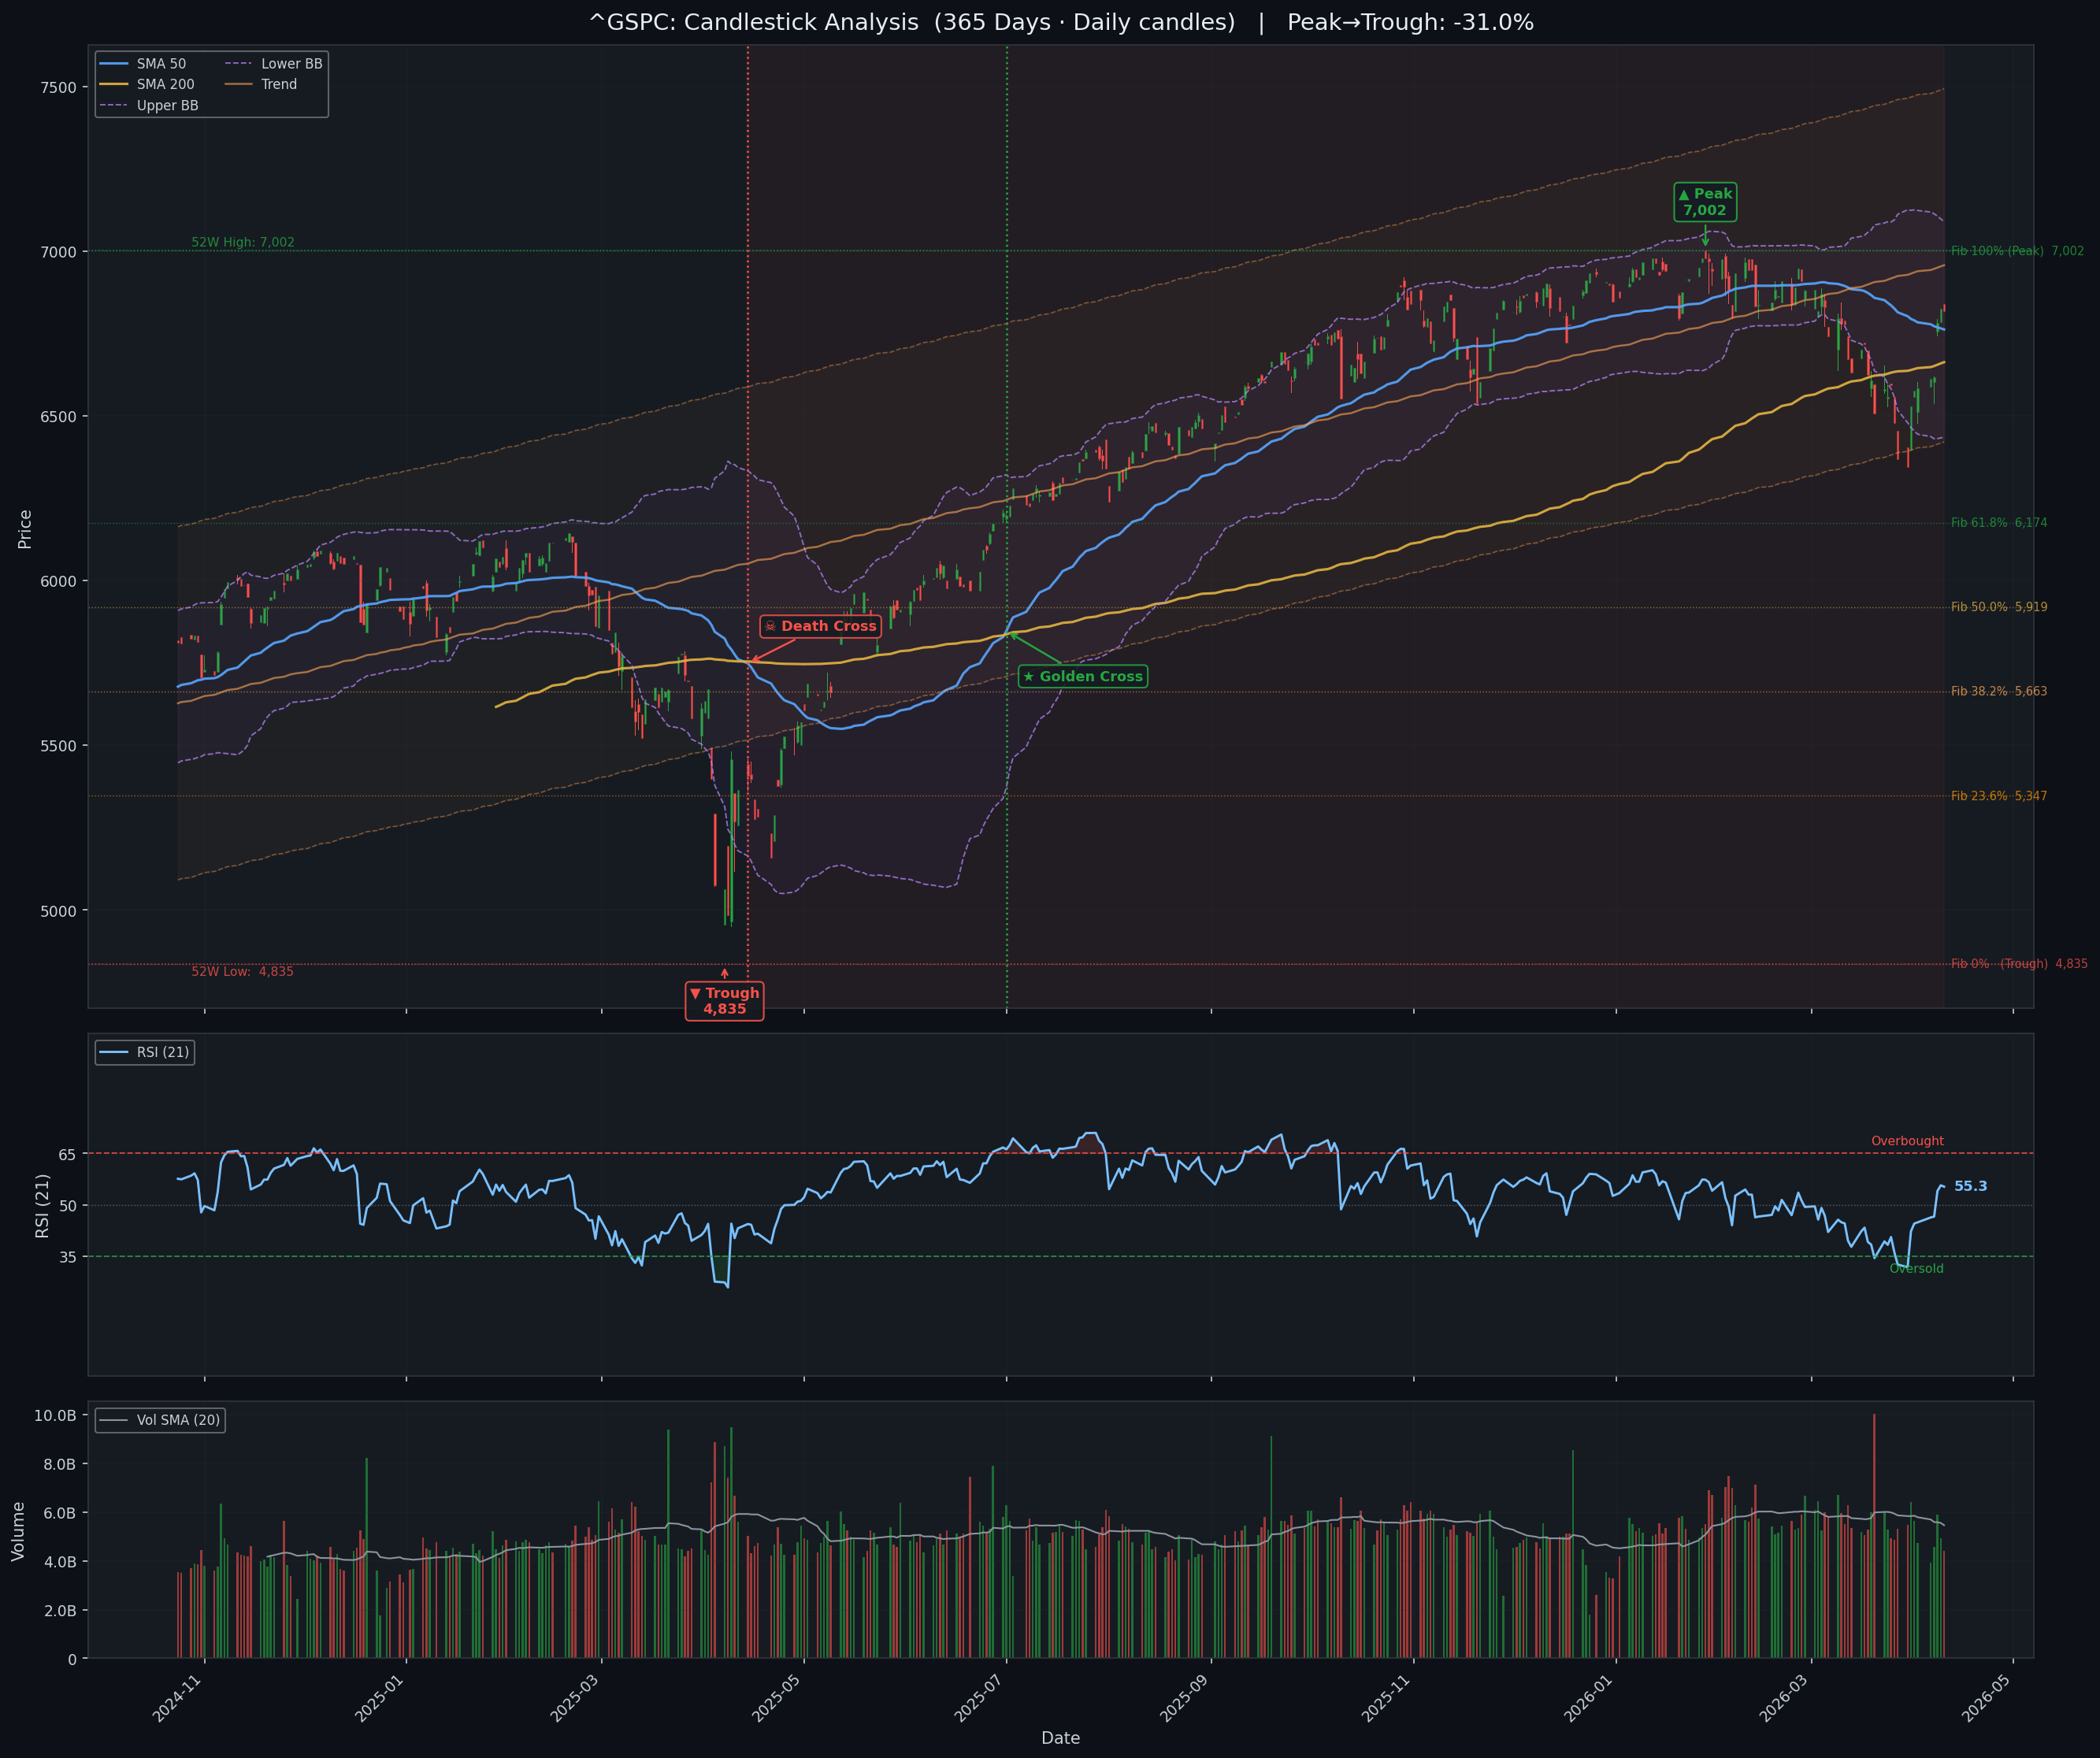
- Max Drawdown (365d): 31.0%
Adaptive Weighted Scoring Analysis
The “Investor” logic (triggered by the N_DAYS ≥ 360 setting) reweights the 10 pillars of analysis to focus on structural health and volume accumulation.
| Section | Weight | Score | Contribution | Signal |
|---|---|---|---|---|
| Trend (SMA · Structure) | 30% | +0.33 | +0.100 | Bullish |
| Momentum (RSI · Stoch · MACD) | 25% | +0.17 | +0.042 | Neutral |
| Trend Strength (ADX · DI) | 20% | +0.00 | +0.000 | Strong Trend |
| Volume & Flow (OBV) | 15% | +0.75 | +0.112 | Accumulation |
| Drawdown & Position | 8% | +0.50 | +0.040 | Minor Pullback |
| Volatility (BB · ATR) | 2% | -1.00 | -0.020 | Elevated |
| Weighted Total | 100% | +0.274 | BULLISH |
Primary Signals Identified
1. Volume & Flow (Accumulation)
The most significant data point in this report is the Volume & Flow score of +0.75. The On-Balance Volume (OBV) indicates that capital is flowing back into the index during upward price movements, suggesting institutional accumulation is currently offsetting retail distribution.
2. Trend Transformation
The Trend component has reached a score of +0.33. This reflects price action reclaiming key short-to-medium-term moving averages. While the 200-day SMA remains a point of interest, the immediate structural pressure has eased.
3. Volatility & Risk
Volatility remains the most significant outlier with a score of -1.00. Both the Average True Range (ATR) and Bollinger Band width indicate that price swings remain historically wide, which accounts for the “Low” (27%) confidence rating despite the Bullish verdict.
Full 19-page Technical Report
The complete 19-page report includes Monte Carlo simulations (1,000 paths), Fibonacci retracement levels for the 365-day range, and detailed momentum oscillators.
👉 Download Full PDF Report: ^GSPC 365d - April 11, 2026
Generated with Python and matplotlib · @lbarqueira.bsky.social
Disclaimer: This report is for educational purposes only and does not constitute financial advice. Analysis is based on historical data and automated indicators which are lagging by nature. Monte Carlo simulations are probabilistic and not price guarantees.